Attitude History Plots
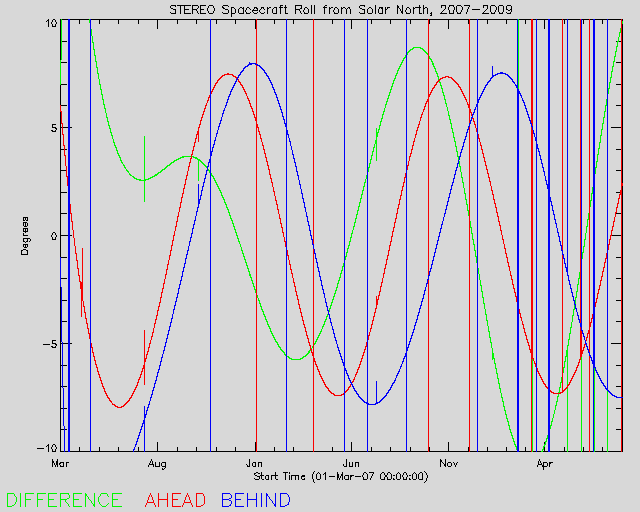
This page provides information on the error in different sources of attitude history of the STEREO spacecraft as it relates to SECCHI COR 2 image headers. (Note that this is NOT a description of ACTUAL attitude! Here is a link to a plot of spacecraft roll. Headers from other telescopes may not exhibit this error if they have been reprocessed. There are three sets of attitude data which are compared: 1. Yaw/pitch/roll from STEREO attitude history files (SPICE) that is in the level 0.5 FITS header, 2. Y/p/r from SPICE at the time the plot was generated, and 3. Y/p from GT averaged telemetry
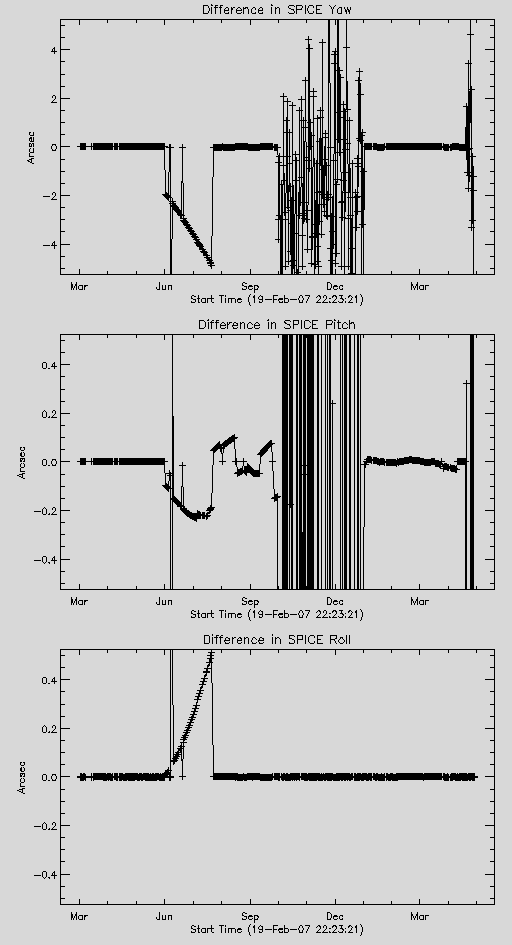
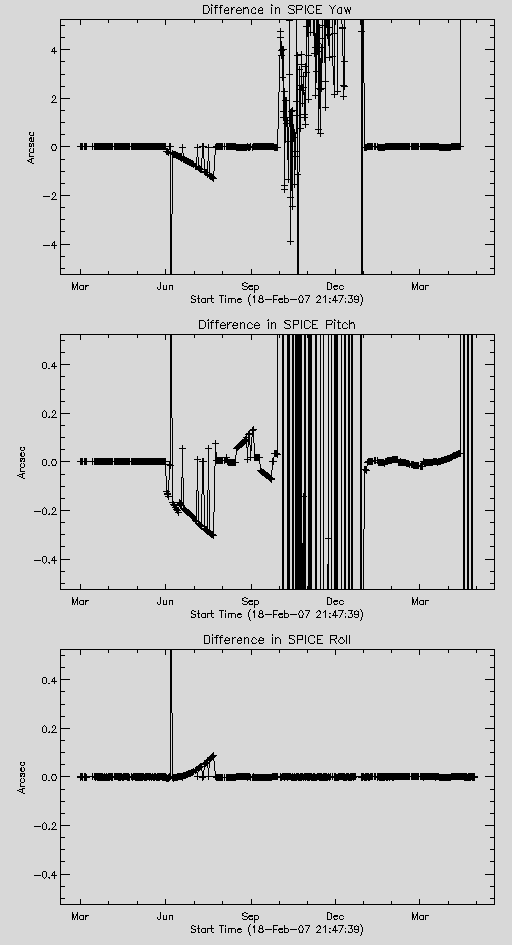
The first set of three plots show the difference in y/p/r between the time the FITS file was written and the time this plot was generated. It illustrates the changes in attitude history as new versions are released. There is one set of three for A and one for B.
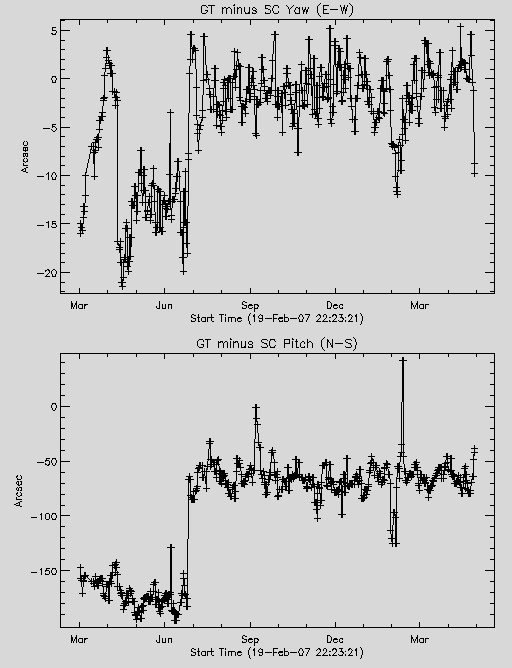
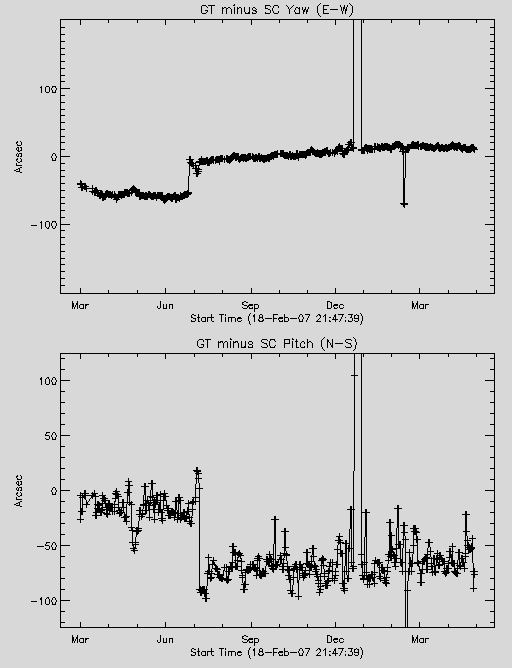
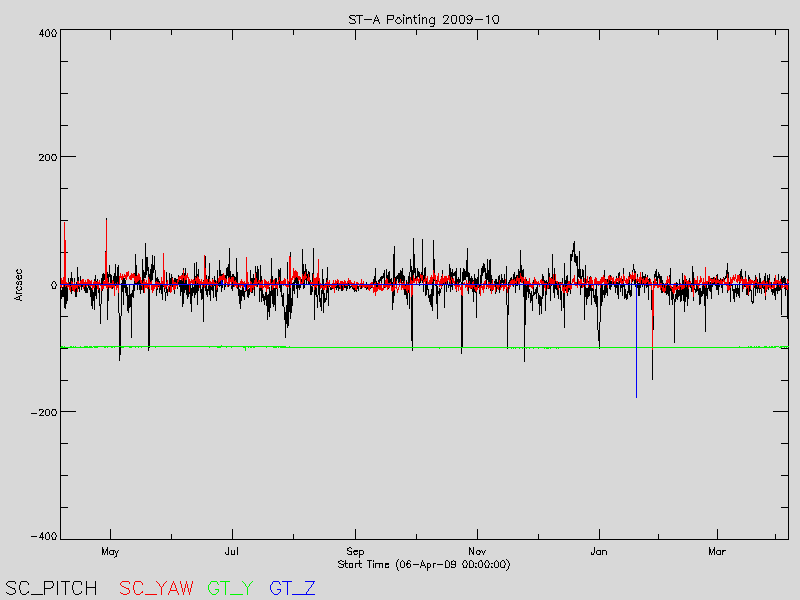
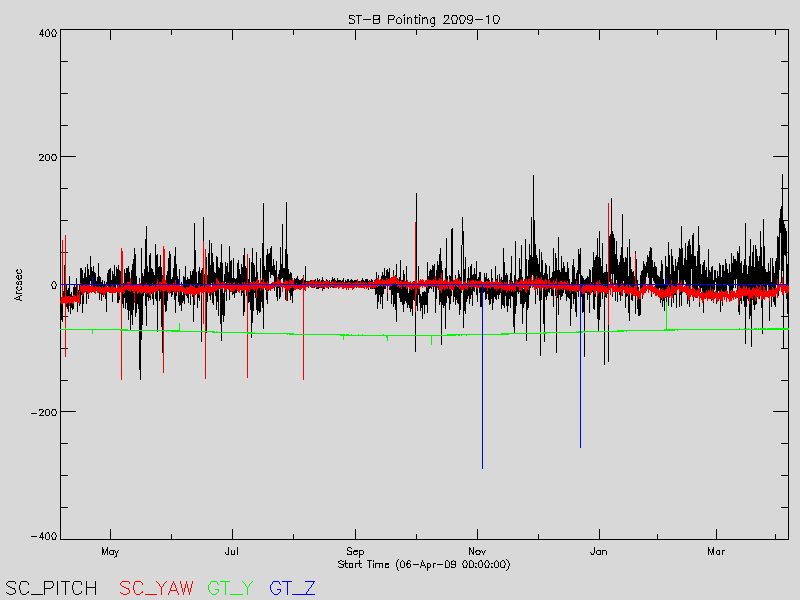
The second set of two plots (one set for A and one for B) show the difference in y/p between the most recent attitude history used for the previous plots and the GT-derived pointing.
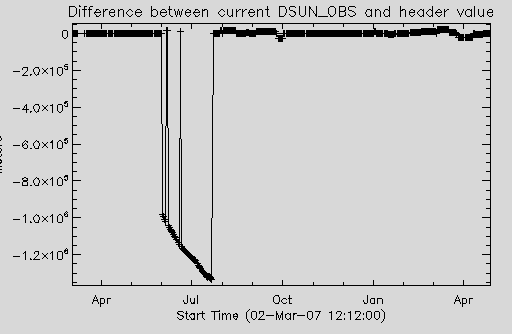
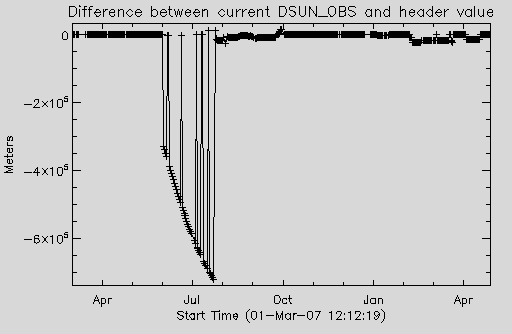
The third set of single plots shows difference in DSUN_OBS (distance to sun center).
Plots created by NR using stereoyperr.pro on 5/1/08.
STEREO-A COR 2 DOUBLE
STEREO-B COR 2 DOUBLE
SPICE Vs GT
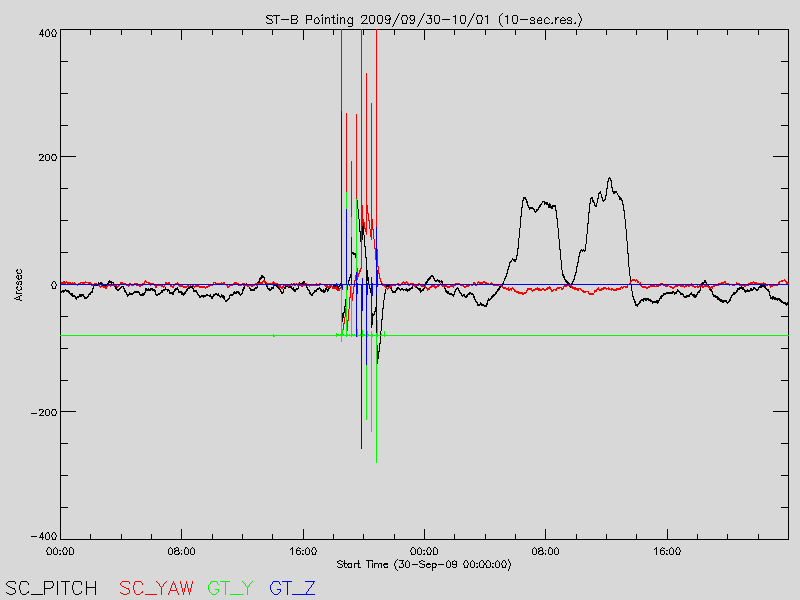
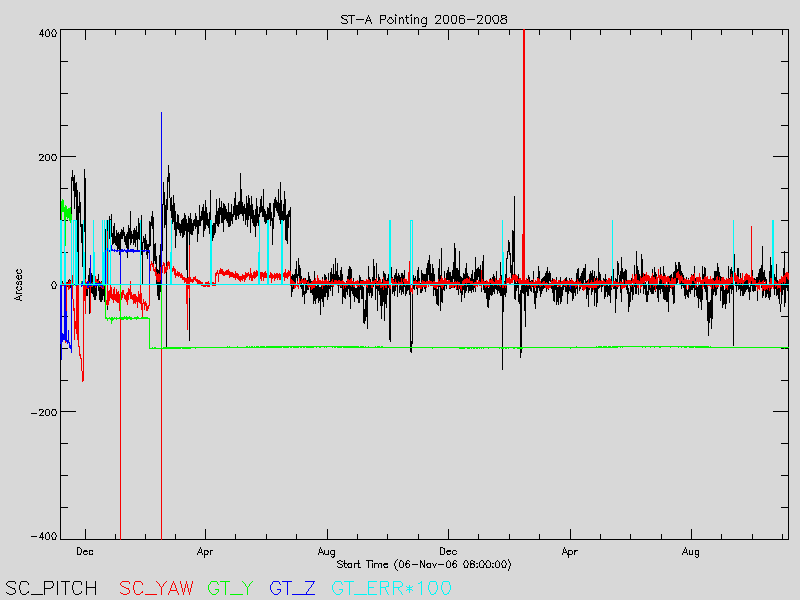
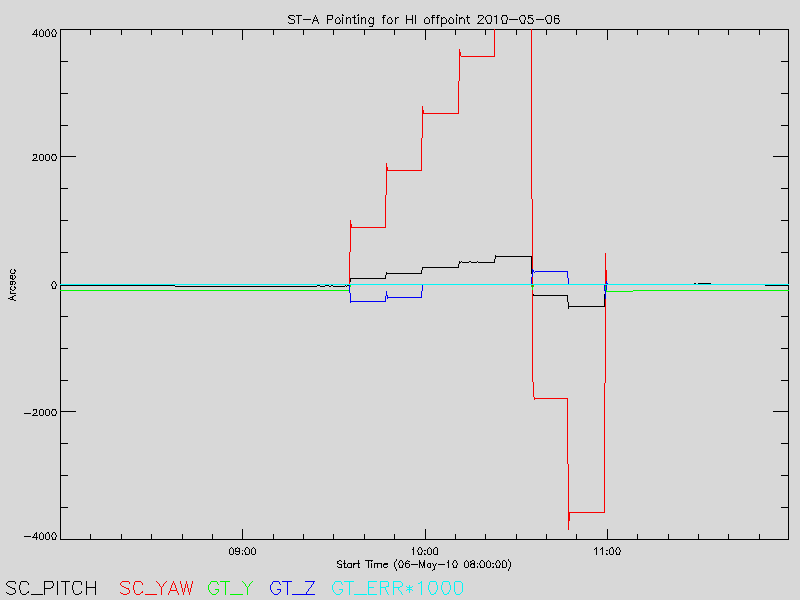
After the HI offpoints on ST-A and ST-B on 2010/05/06, it was apparent that the actual pointing values were not reflected in the image FITS headers. These plots were generated to get a better picture of the behavior of the SPICE (from GET_STEREO_HPC_POINT.PRO) and GT values (from SCC_SUNVEC.PRO) over the mission.
This is a close-up of 2009 Sep 30 - Oct 1 (B):