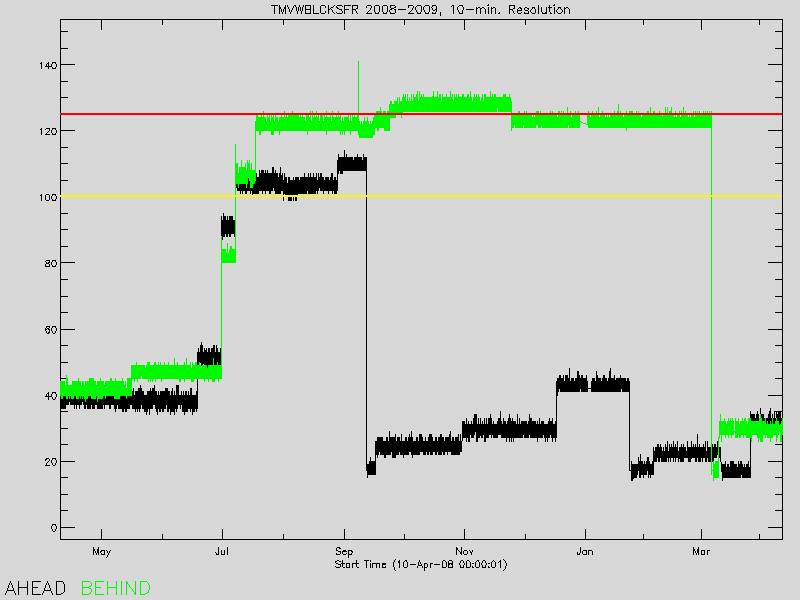
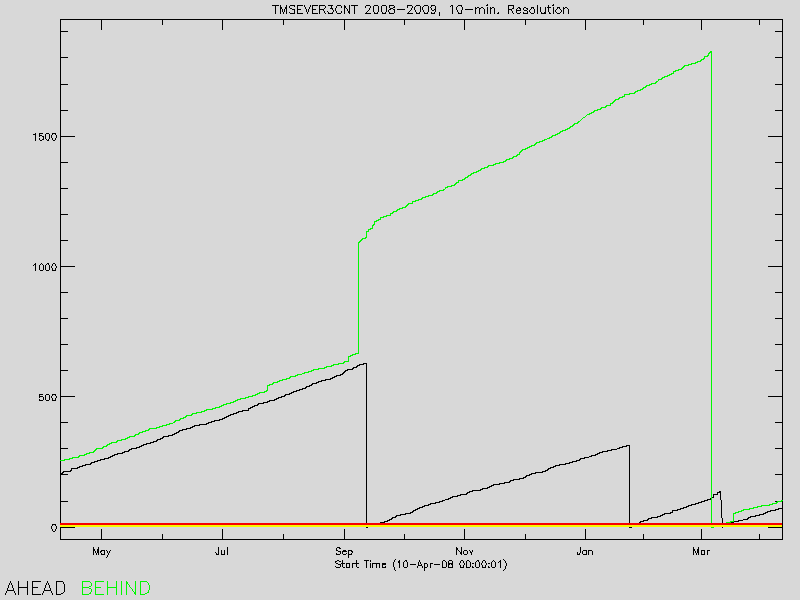
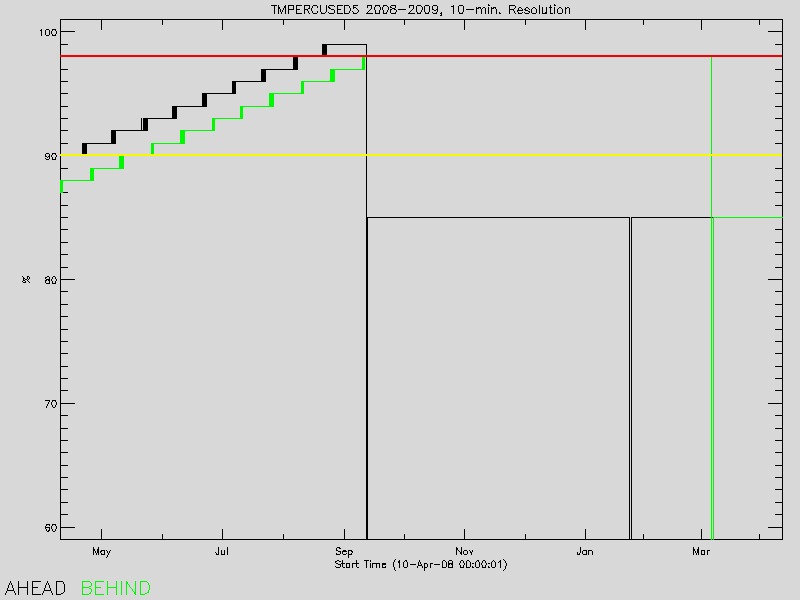
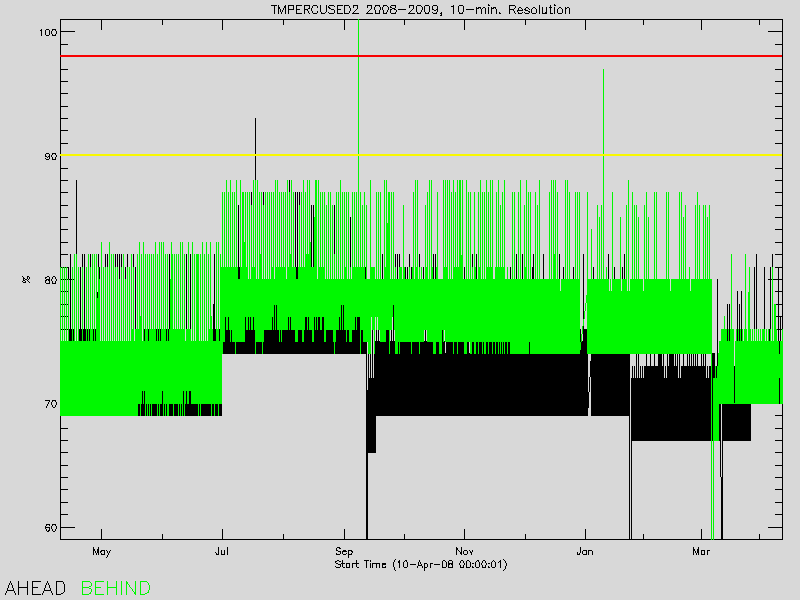
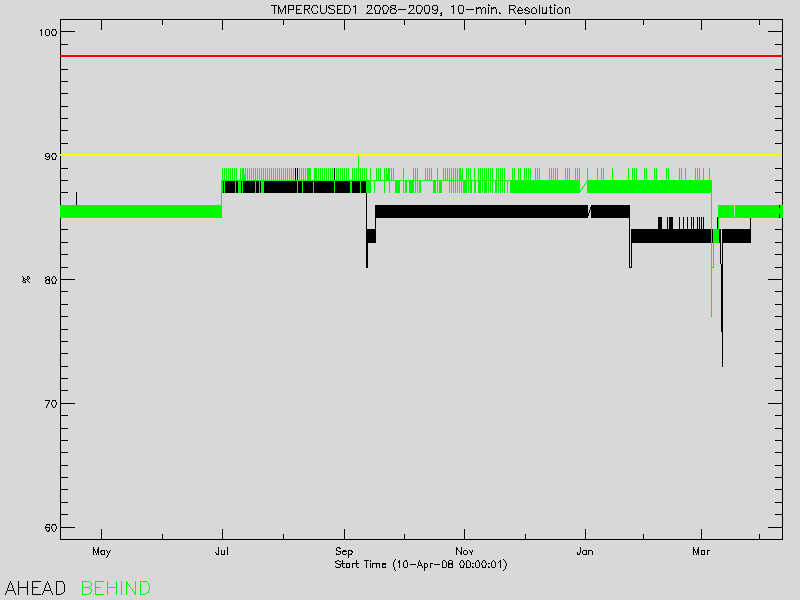
The following plots are for Task-Manager module telemetry that exceeded a limit more than a few times in the last year. A yellow horizontal line indicates the Yellow Limit that was in effect, a red line indicates the Red Limit:
To view full resolution plots, right click on it and choose View Image (or equivalent).
In May 2024, Earth experienced some of the most intense geomagnetic storms seen in recent years. Solar eruptions that led to these storms were imaged by the SECCHI HI-2 camera on NASA STEREO-A. This image sequence shows the large CME front passing over Earth (far left, not to scale) along with concurrent Kp observations, which shows the Earth's geomagnetic response to the event.
Observations from the SECCHI HI-2 camera on May 12, 2024 (top), along with the concurrent "kp" geomagnetic activity index (lower). The location of Earth is as indicated on the left of the animation. [Credits: NASA/NRL/STEREO]
SECCHI is a suite of 5 scientific telescopes that observe the solar corona and inner heliosphere from the surface of the Sun to the orbit of Earth.
STEREO launched at 8:52pm EDT Oct 25, 2006 from Kennedy Space Center in Florida atop a Delta II rocket.