
To view full resolution plot, right click on it and choose View Image (or equivalent).
EA ModeSECCHI Bus Voltages from S/C for 2006-11-06 EA-mode test on Ahead: 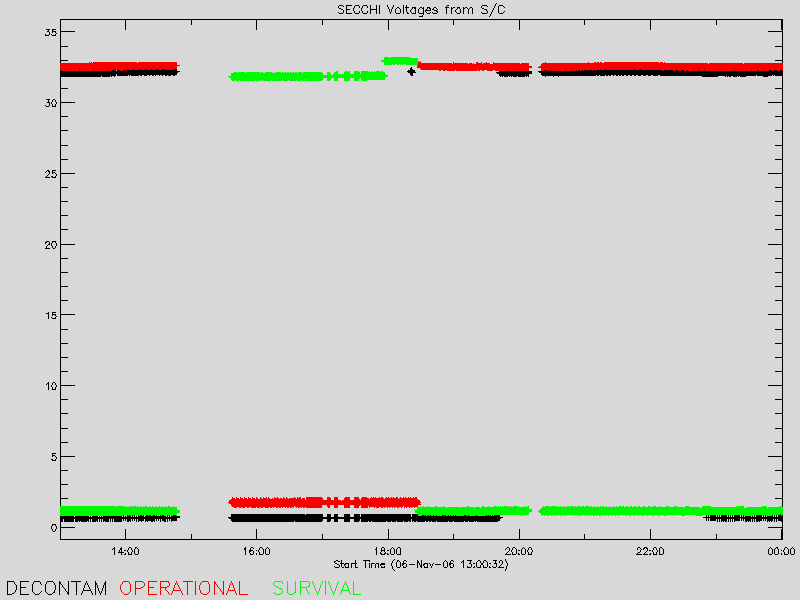 |
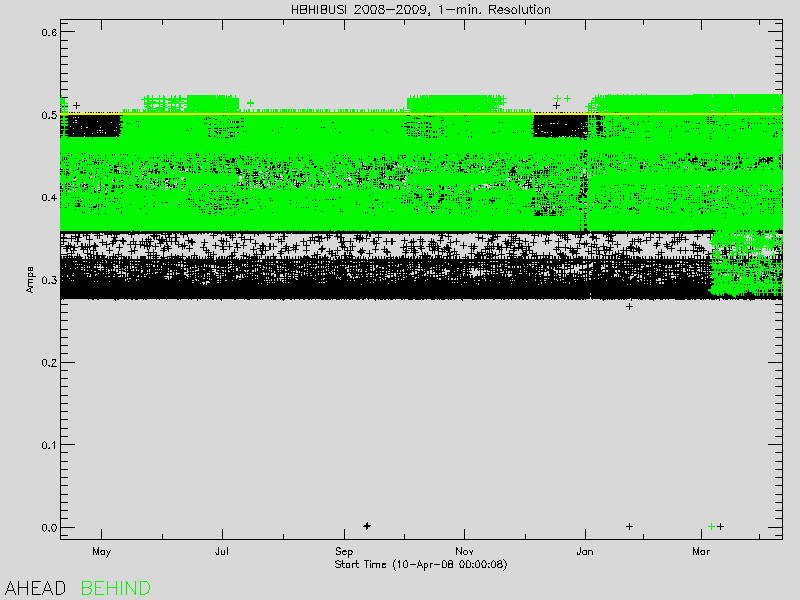
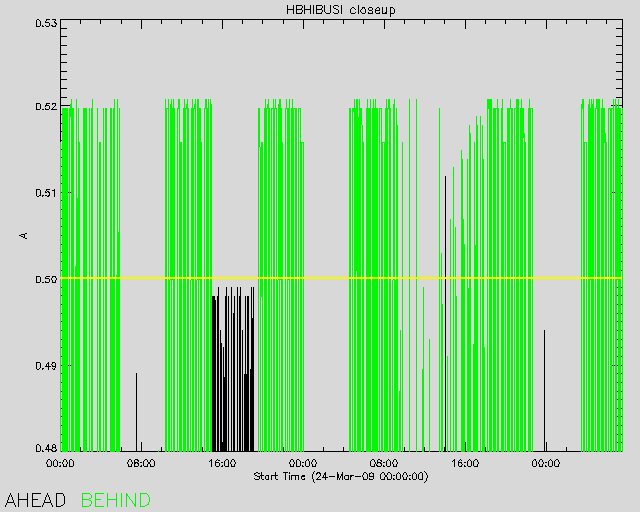
Limit AnalysisThe following plots are for current telemetry (Amps) that exceeded a limit more than a few times in the last year. A yellow horizontal line indicates the Yellow Limit that was in effect, a red line indicates the Red Limit: 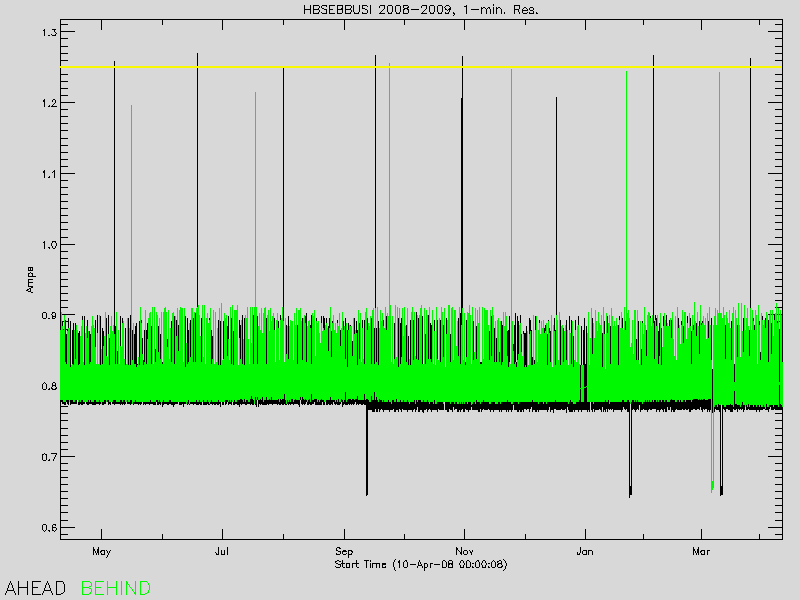
|