Schedule Blocks
Worksheet for increased COR 2 cadence
Assumes 1024x1024 COR 2 Double images with Icer6 compression and replacing the polarized sequence with Double.
Table showing relative Icer compression factors is here.
MB/day for blocks in use

Release notes for the publication number can go here
Assumes 1024x1024 COR 2 Double images with Icer6 compression and replacing the polarized sequence with Double.
Table showing relative Icer compression factors is here.
MB/day for blocks in use
Around the time of conjunction when the spacecraft go behind the sun relative to Earth, science return is significantly reduced. This period runs from 19 Aug 2014 (1 Dec 2014) for Ahead (Behind) until Jan.2016 for both spacecraft. There are four levels of reduced data for this period: Sidelobe 1 at 5330 bps for SECCHI, Sidelobe 2 at 1005 bps, 34m at 364 bps, and OFF. Details of this period may be found on the SSC Website. Following are details of the SECCHI observing program.
(2012/04/30)
Table showing relative Icer compression factors is here.
Synoptic Maps
Synoptic Map Monthly Summary
Carrington Maps: by Instruments
Carrington Maps: by Carrington Rotation
Filename convention is of the form YYYYMMDD_MMDD_CAM.mpg
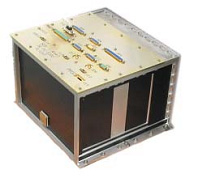
The Cor2 coronagraphs are part of the Sun Earth Connection Coronal and Heliospheric Investigation (SECCHI) package onboard the twin STEREO spacecraft. The Cor2 detectors each observe a range from 2 to 15 solar radii.
In May 2024, Earth experienced some of the most intense geomagnetic storms seen in recent years. Solar eruptions that led to these storms were imaged by the SECCHI HI-2 camera on NASA STEREO-A. This image sequence shows the large CME front passing over Earth (far left, not to scale) along with concurrent Kp observations, which shows the Earth's geomagnetic response to the event.
Observations from the SECCHI HI-2 camera on May 12, 2024 (top), along with the concurrent "kp" geomagnetic activity index (lower). The location of Earth is as indicated on the left of the animation. [Credits: NASA/NRL/STEREO]