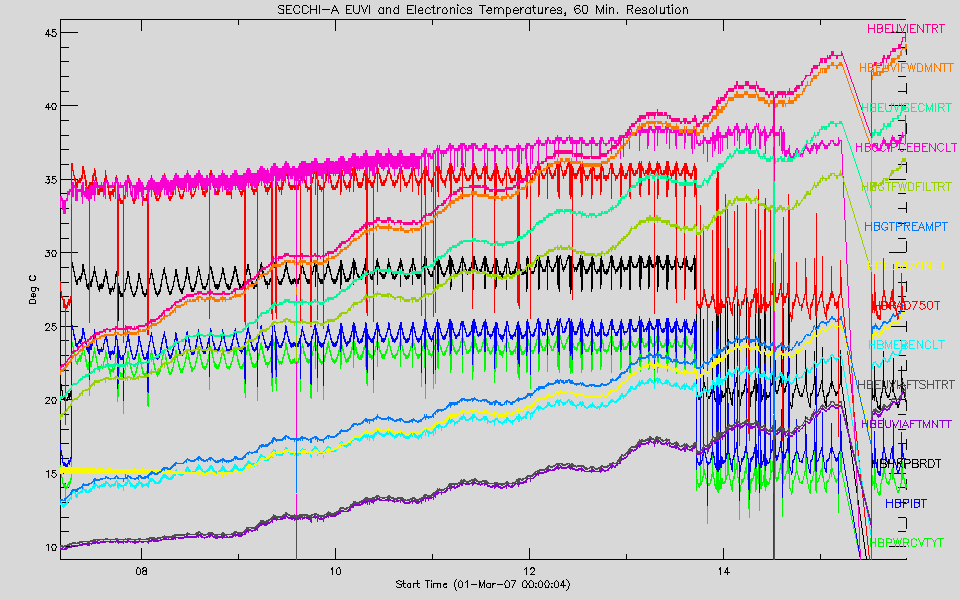
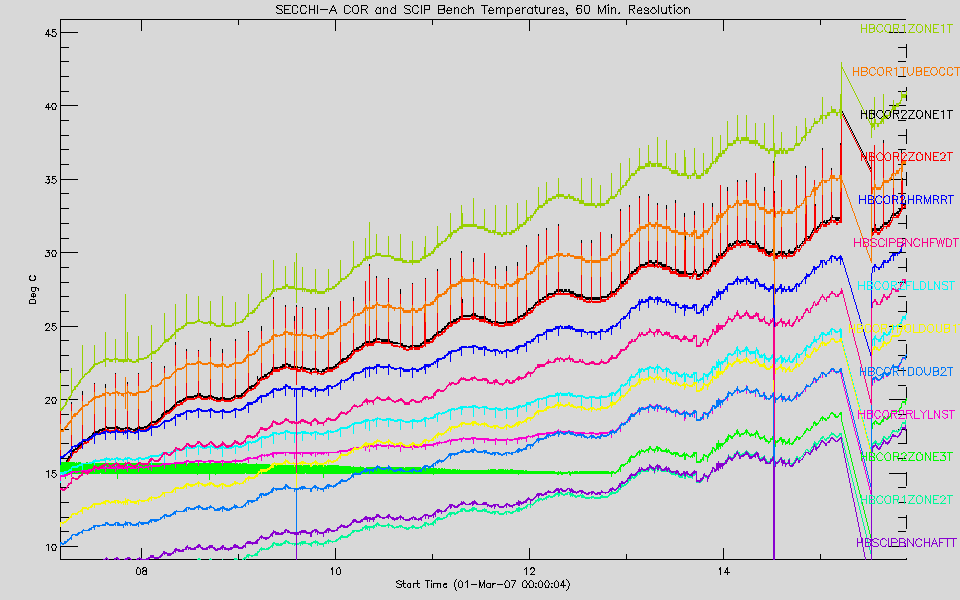
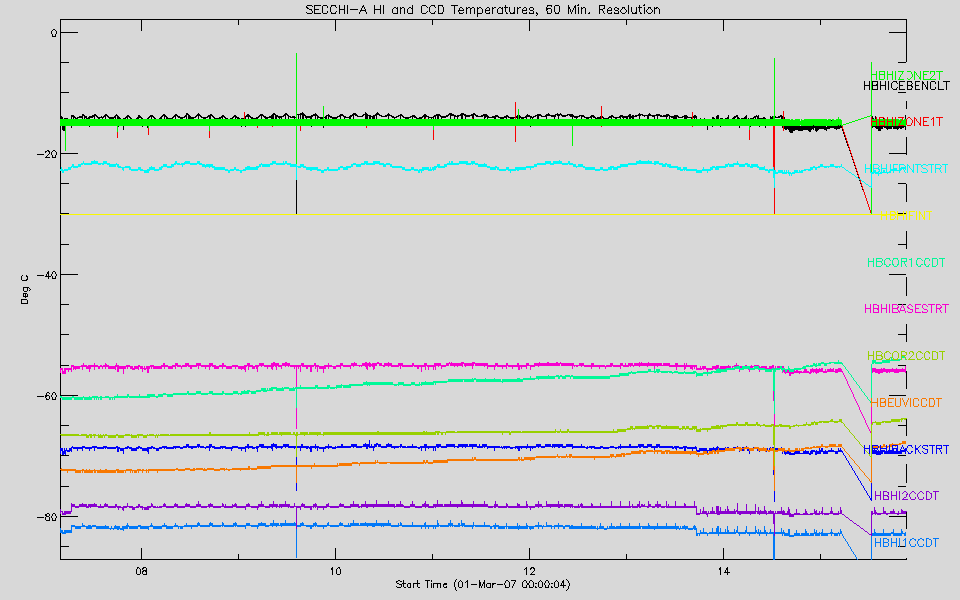
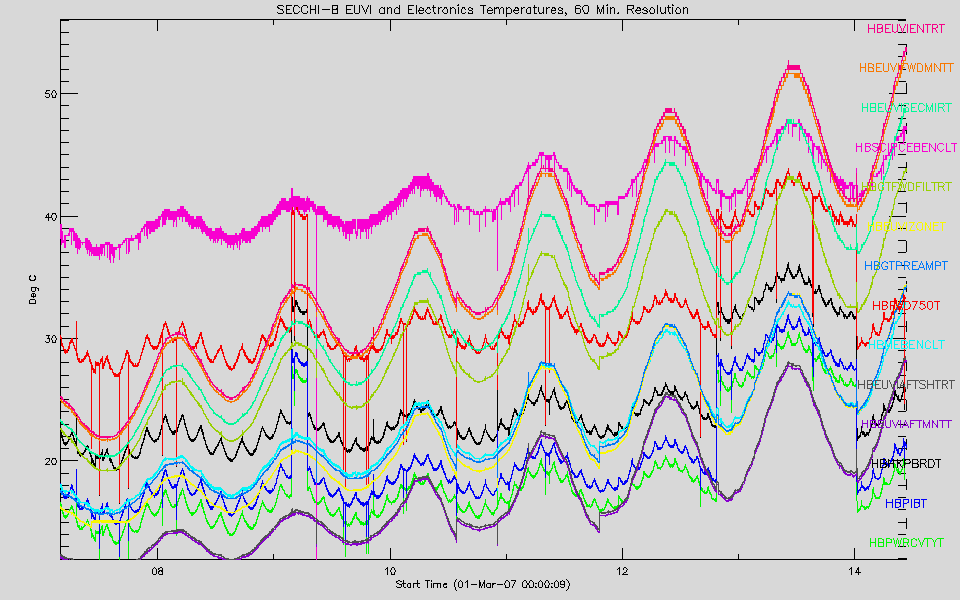
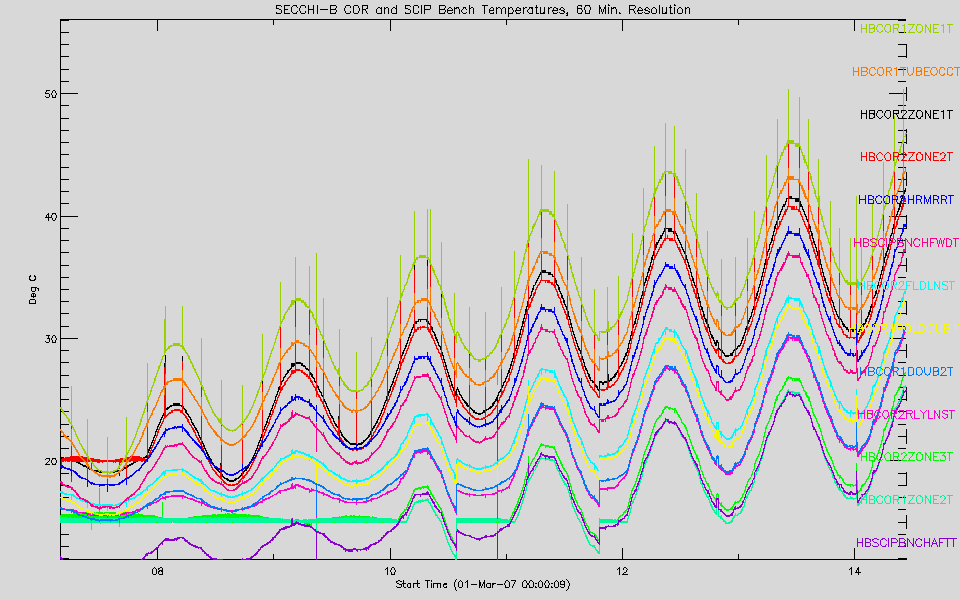
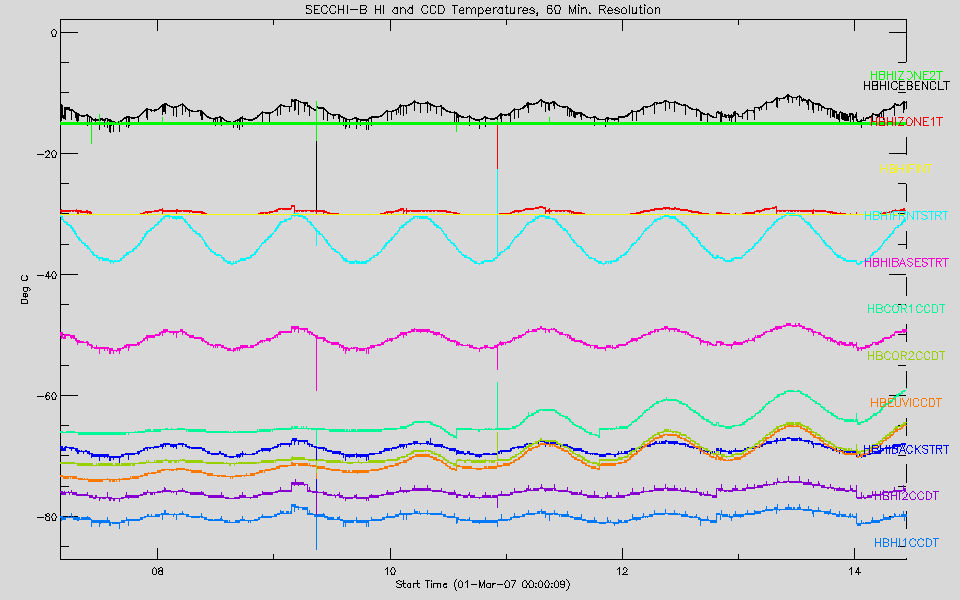
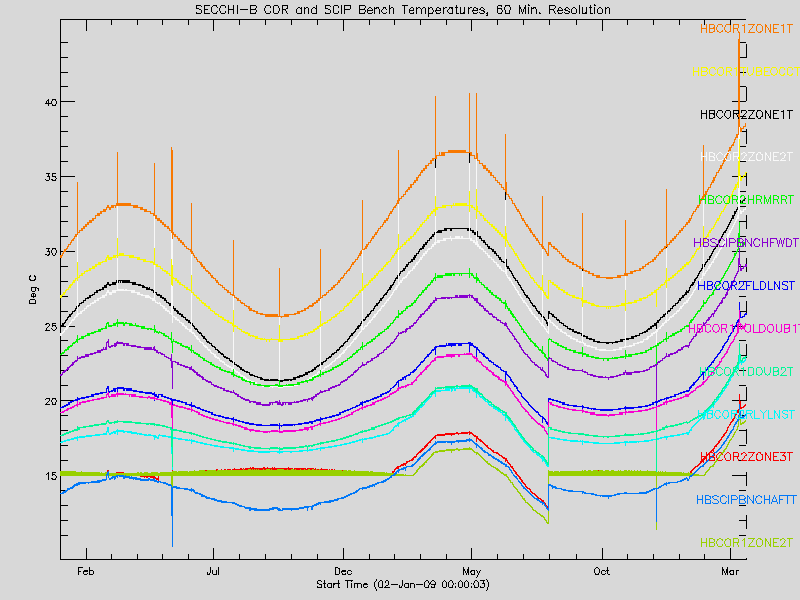
Plots of all housekeeping board temperatures at 1 hour resolution from 2007/03/01 - 2015/11/20(A) - 2014/06/13(B)

Plots generated using sccplottemps.pro and the NRL My SQL database.

Temperature Limits (pdf)

A

B

Graph of EUVI and Electronics boxes (A)
EUVI and Electronics boxes
Graph of COR 2, COR 2, and SCIP Bench (A)
COR 2, COR 2, and SCIP Bench
Graph of HI and CCD (A)
HI and CCD


Graph of EUVI and Electronics boxes (A)
EUVI and Electronics boxes
Momentum Dump (Door closed)
COR 2, COR 2, and SCIP Bench
Graph of HI and CCD (B)
HI and CCD


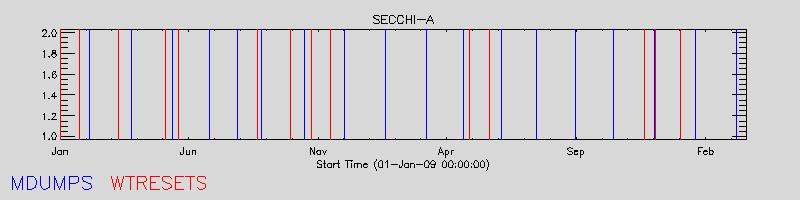
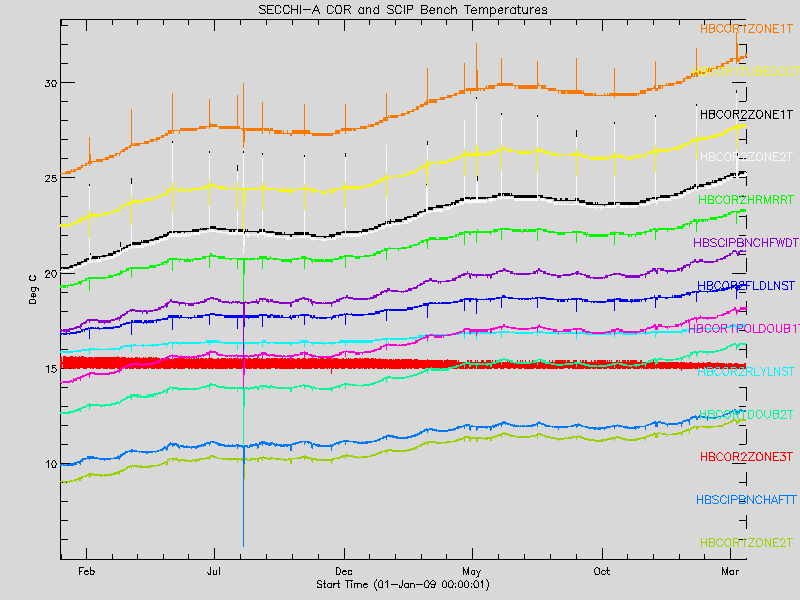
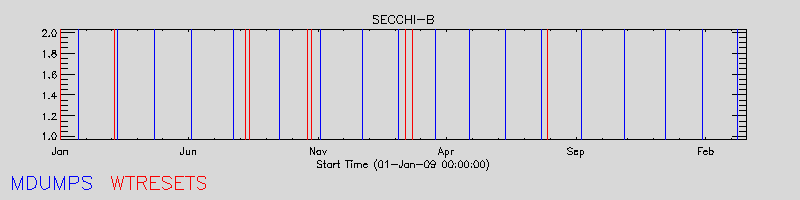
2-yr plot showing correlation with Mdumps and WT Resets:

Plots generated using sccplottemps.pro and the NRL My SQL database.

A

B

Graph of Mdumps and WT Resets (2-yr time range) (A)
Mdumps and WT Resets (2-yr time range)
Graph of COR 2, COR 2, and SCIP Bench (2-yr time range) (A)
COR 2, COR 2, and SCIP Bench (2-yr time range)


Graph of Mdumps and WT Resets (2-yr time range) (B)
COR 2, COR 2, and SCIP Bench
Graph of COR 2, COR 2, and SCIP Bench (2-yr time range) (B)
COR 2, COR 2, and SCIP Bench (2-yr time range)