Query/Plot SECCHI Housekeeping Telemetry
Plots of HB Temperatures
All Temperatures - Post-Conjunction plots
Plots of IC Temperatures, 2010 - 2013/04/26
- All Temperatures - 3yr plots
- All Temperatures - Full Mission
- Temperatures During Momentum Dump
- Temperature Anomaly on SECCHI-B
- Doors Closed on SECCHI-B
EA Mode
Limit Analysis
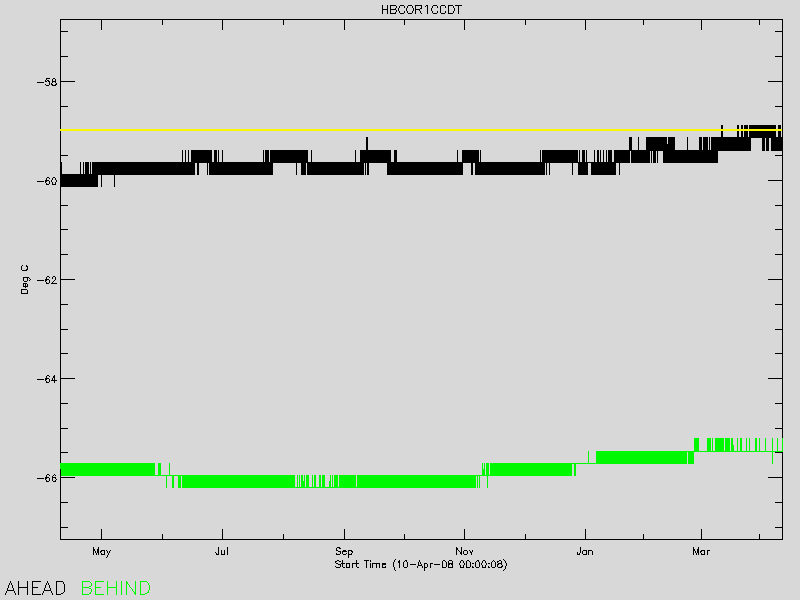
The following plot is for temperature telemetry that exceeded a limit more than a few times in the last year. A yellow horizontal line indicates the Yellow Limit that was in effect:
To view full resolution plots, right click on it and choose View Image (or equivalent).
HBCOR 1 CCDT