EA Mode Test On 06 Nov 06
Plots for STEREO-Ahead
- To view full resolution plots, right click on it and choose View Image (or equivalent).
- Times are packet time
Release notes for the publication number can go here
Plots for STEREO-Ahead
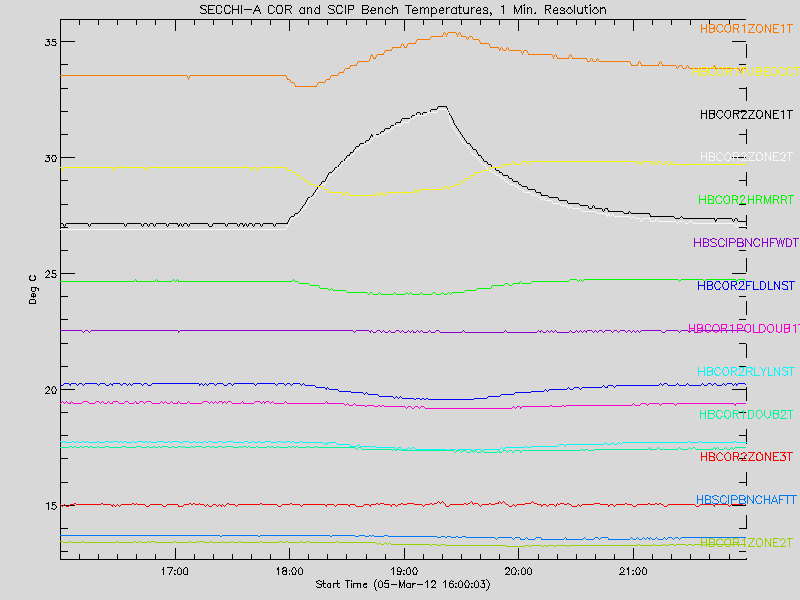
For Momentum Dump on Behind 2014/07/28 16:15, the COR 1 and COR 2 doors remained closed for 33 hours due to a schedule error. Here are the temperature plots from that event.
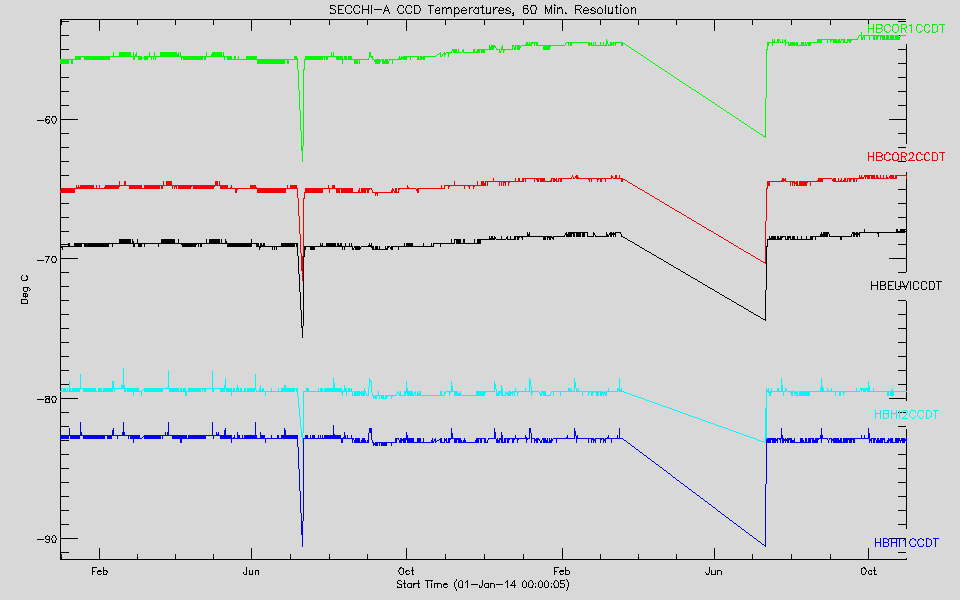
Plots of all housekeeping board temperatures at 1 hour resolution from 2007/03/01 - 2015/11/20(A) - 2014/06/13(B)A ~10 deg increase in electronics temperatures is observed on Oct 22, 2012. A similar thing happened on Feb. 24, 2009, and it corrected itself on Apr. 15, 2009. |

Plots of all housekeeping board temperatures at 1 hour resolution from 2007/03/01 - 2015/11/20(A) - 2014/06/13(B)Plots generated using sccplottemps.pro and the NRL My SQL database. |
Plots of all housekeeping board temperatures at 30 min resolution from 2010/06/07 - 2013/06/07Plots generated using sccplottemps.pro and the NRL My SQL database.
|

|
Plots of COR 1 non-CCD temperatures from 2007-2011Plots generated using sccplottemps.pro and the NRL My SQL database. Spikes in long range plots represent momentum dumps when the doors are briefly closed.
|
Scale: 100% on = 256
Plots of all housekeeping board temperatures at 1 hour resolution from 2006/11/01 - 2008/01/01Plots generated using sccplottemps.pro and the NRL My SQL database. |
In May 2024, Earth experienced some of the most intense geomagnetic storms seen in recent years. Solar eruptions that led to these storms were imaged by the SECCHI HI-2 camera on NASA STEREO-A. This image sequence shows the large CME front passing over Earth (far left, not to scale) along with concurrent Kp observations, which shows the Earth's geomagnetic response to the event.
Observations from the SECCHI HI-2 camera on May 12, 2024 (top), along with the concurrent "kp" geomagnetic activity index (lower). The location of Earth is as indicated on the left of the animation. [Credits: NASA/NRL/STEREO]