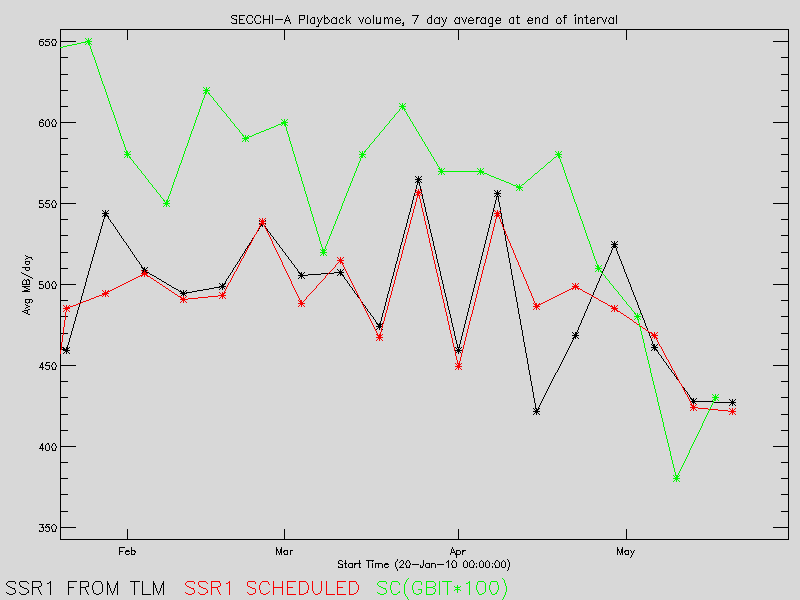
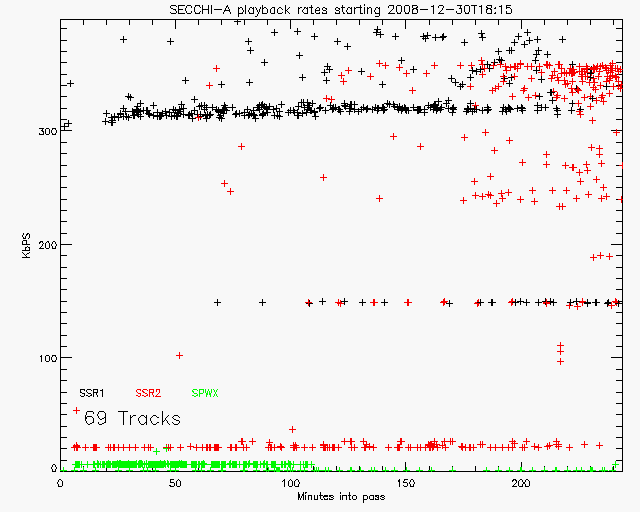
Telemetry Volume Trends
|

Release notes for the publication number can go here
|
|
Number of Processor Watchdog Timeouts
                               A     B
for year ending on:
                2007-10-31     5     4
                2008-10-30     2     2
                2009-10-30     7     5
                2010-10-30     3     3
                2011-10-31     6     1
                2012-10-30     5     1
total:
                2012-10-30    28    16

remainder through 2013/06/05:
                reported       1     3
The following plots show Event Detection and Correction hardware errors for RAD 750 and SWIC cards on SECCHI-A and SECCHI-B. As of 2011/01/01, there have been no reported un-corrected errors.
The following plots are for Task-Manager module telemetry that exceeded a limit more than a few times in the last year. A yellow horizontal line indicates the Yellow Limit that was in effect, a red line indicates the Red Limit:
To view full resolution plots, right click on it and choose View Image (or equivalent).
To view full resolution plot, right click on it and choose View Image (or equivalent).
EA ModeSECCHI Bus Voltages from S/C for 2006-11-06 EA-mode test on Ahead: |
Plots of all housekeeping board temperatures at 5 min resolution from 2015/07/11 - 2017/09/22
Plots generated using sccplottemps.pro and the NRL My SQL database.
All Temperatures - Post-Conjunction plots
Plots of IC Temperatures, 2010 - 2013/04/26
Date: January 24, 2006 4:28:28 PM EST
To: secchi_manage NRL
Subject: SECCHI HK Event Messages in beacon

Folks,

This email describes what severity of event messages means and which event messages are currently sent down SPWX. The full list of event messages may be found at http://ares.nrl.navy.mil/public_html/tcvol2/mnemonics/HKEVENTCODE.html.

This is in preparation for a meeting sometime before Thermal Cycling to discuss what action to take for each event. Don will be making the meeting arrangements.
HI Temperature Mnemonics and Sensor Locations (pdf)
The following figures are from 7906-PRC-9-0-0114 SECCHI SCIP-A Thermal Environmental Test Procedure:
In May 2024, Earth experienced some of the most intense geomagnetic storms seen in recent years. Solar eruptions that led to these storms were imaged by the SECCHI HI-2 camera on NASA STEREO-A. This image sequence shows the large CME front passing over Earth (far left, not to scale) along with concurrent Kp observations, which shows the Earth's geomagnetic response to the event.
Observations from the SECCHI HI-2 camera on May 12, 2024 (top), along with the concurrent "kp" geomagnetic activity index (lower). The location of Earth is as indicated on the left of the animation. [Credits: NASA/NRL/STEREO]